Spreadsheet is a computer software that displays data in a two-dimensional grid and includes formulas to link the data. Spreadsheets are mostly used for data manipulation and analysis, and this is enhanced by their tabular form. Spreadsheet formulas enhance data computation, manipulation, and analysis at all levels.
This guide on the uses of spreadsheet formulas is meant to assist anyone using spreadsheet software to work efficiently. In this guide, you will learn the following concepts.
- How to use basic spreadsheet formulas in your daily operational activities
- Understand the essential uses of spreadsheet software in a production environment
- Learn of free and proprietary spreadsheet alternatives to Microsoft Excel and Google Sheets
- Practice basic keyboard shortcuts for speedy and effective delivery of services.
If you are willing to learn, let’s get started.
What is Spreadsheet?
In this section, I’ll introduce you to spreadsheet application software. You’ll learn the meaning of a spreadsheet, types of spreadsheets, and the basic features of a spreadsheet package.
Spreadsheet meaning
A spreadsheet can be defined as a computer program for organizing, calculating, and storing data in tabular form. It represents data in a two-dimensional grid and includes formulas to perform computation and analysis on the data.
Spreadsheets were created as digital substitutes for traditional paper accounting spreadsheets. Traditionally, a spreadsheet is an accounting ledger page that shows various quantitative information useful for managing a business. Electronic spreadsheets replaced these manually computed spreadsheets.
The data entered into a spreadsheet’s worksheet cells is what the program uses to function. Each cell may include text, numeric data, or formula results. The spreadsheet formulas automatically calculate and display values based on the contents of neighboring cells.
Spreadsheet software has built-in formulas that enhance its uses for financial and statistical operations. Using today’s electronic spreadsheet as an office productivity tool, you can:
- Adjust values on cells to perform what-if-analysis
- Link multiple cells, worksheets, and workbooks to display values
- Perform numeric and graphical analysis, and much more.
Due to their speed and accuracy, spreadsheet applications have replaced the traditional paper spreadsheet in the modern workplace.
Origin
Based on Mainframe and time-sharing computers, LANPAR was the first electronic spreadsheet program. LANPAR means LANguage for Programming Arrays at Random and was developed in 1969.
For Microcomputers, VisiCalc was the first spreadsheet program. It was developed in 1979 and contributed to the success and wide adoption of the Apple II computer.
When Disk Operating System (DOS) was the preferred operating system, Lotus 1-2-3 was the top spreadsheet application. However, Microsoft Excel dominates both the Windows and Macintosh platforms in recent times.
Types of spreadsheets
Spreadsheets can be classified based on their features and functionality. Although you can also classify based on the accessibility.
Types of spreadsheets based on features and functionality include simple spreadsheets, tables, and pivot tables.
Based on accessibility, we have standalone, cloud-based, and free spreadsheets. These platforms provide users access to users who want to compute and analyze data.
Simple worksheet
A simple worksheet, otherwise called simple tables uses range to define and link data to formulas. When this happens, additional rows or columns must be extended manually. Except if they are inserted between the defined ranges. If neither of the two happens, then. The formula’s calculation will omit the newly entered data. This type of spreadsheet was predominantly used in Excel versions before version 2007.
Excel tables
From Microsoft Excel 2007 till date, Excel provides the table tool that enables you to create a distinct table. By inserting a table in a worksheet, all data in the range is automatically addressed within the table. When rows and columns are added, they are automatically updated. Table names, rather than ranges, are used to reference formulas thereafter.
Pivot tables
This is an excellent way to summarize, analyze and compare data in a spreadsheet. Popular spreadsheets provide this tool. With pivot tables, spreadsheet users can analyze relational data and export portions of the data that have been sorted, summarized, and filtered.
The above types of spreadsheets are available on most spreadsheet platforms. Whether, proprietary, commercial, cloud-based, or free version.
Features of spreadsheet software
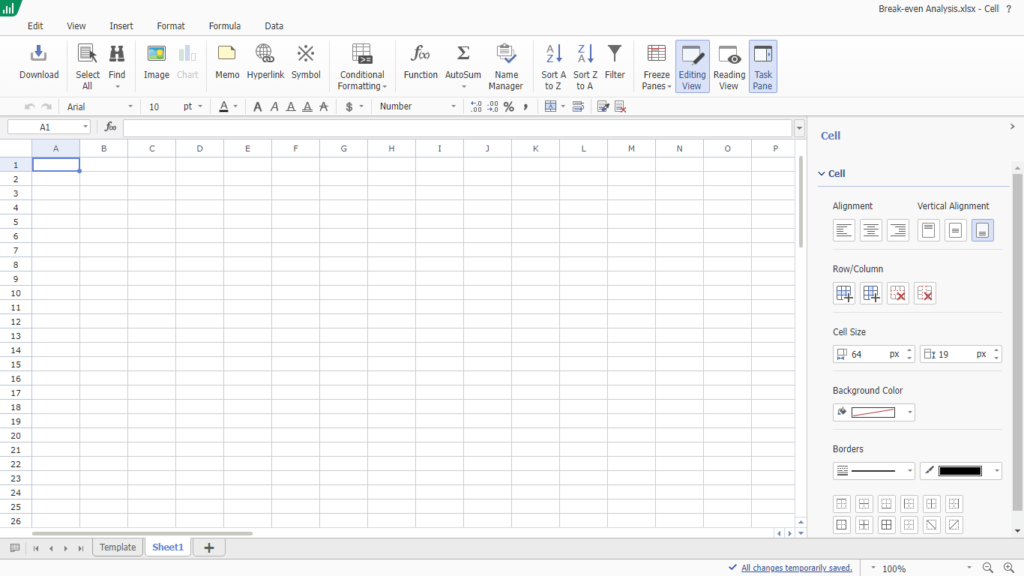
Virtually all spreadsheet software has the same features except for insignificant differences. For example, Microsoft Excel uses tabs and ribbons while Zoho and Google Sheets use menu and standard toolbar.
In this subsection, we’ll look at the common features of spreadsheet packages. As samples, we’ll consider Microsoft Excel, Google Sheets, and Zoho Sheets.
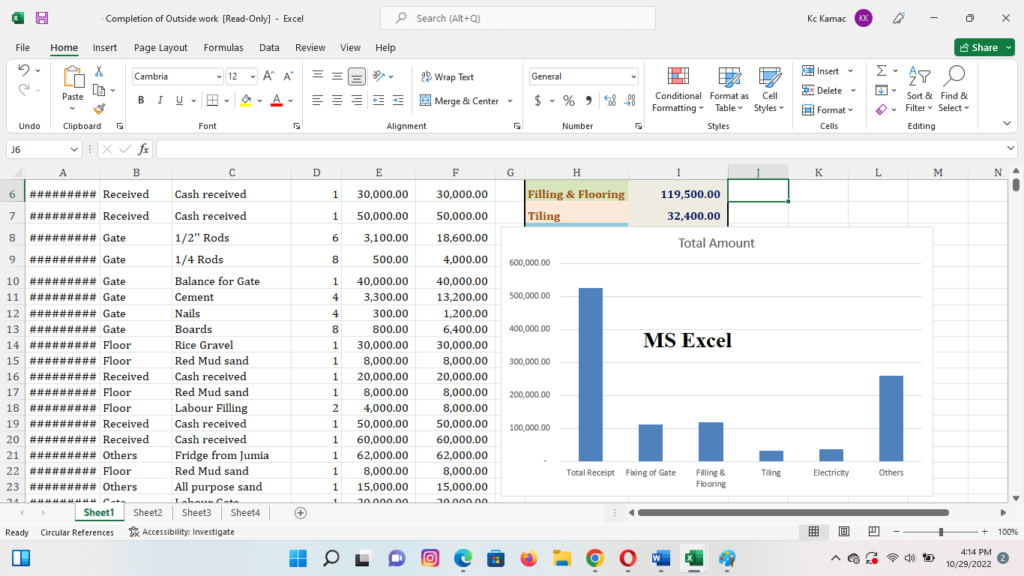
The numbers on the above image are explained sequentially below.
- Title: The title is the name given to an open or current spreadsheet. It is the name used to save the current spreadsheet file.
- Menu bar or tabs: The menu bar contains the list of commands that can be executed on the current spreadsheet. Microsoft Excel 2007 – date uses tabs that display a ribbon (list of commands) instead of a menu bar. In Google or Zoho sheet, when a menu is selected, a list of commands dropdown for the user to select.
- Standard toolbar: This is a list of frequently used commands for ease of access. This bar makes it easier for a user to locate a command instead of visiting the menu bar. Microsoft Excel 2007 – date uses ribbon and quick access toolbar.
- Share button: Used to share and collaborate with teammates on the current spreadsheet.
- Name box or address bar: Displays the address or cell reference of the active cell or range or table. It is also used to name a cell or range.
- Functions button: click to display the inbuilt functions dialog box of the spreadsheet software.
- Formula bar: Displays the content of an active cell. Also, used to rewrite the content of an active cell.
- Cell: The intersection of a column and a row where data is being entered.
- Rows: Horizontal bars on the spreadsheet window that begins with No. 1 through 65536 in the Zoho sheet.
- Columns: vertical bars on the spreadsheet window that begins with A and end with Z in Google sheet.
- Worksheet: A workspace on a current spreadsheet that is made up of a grid of columns and rows. One spreadsheet can hold many worksheets. The worksheet tabs located at the base of the spreadsheet window can be used to name, rename and select worksheets.
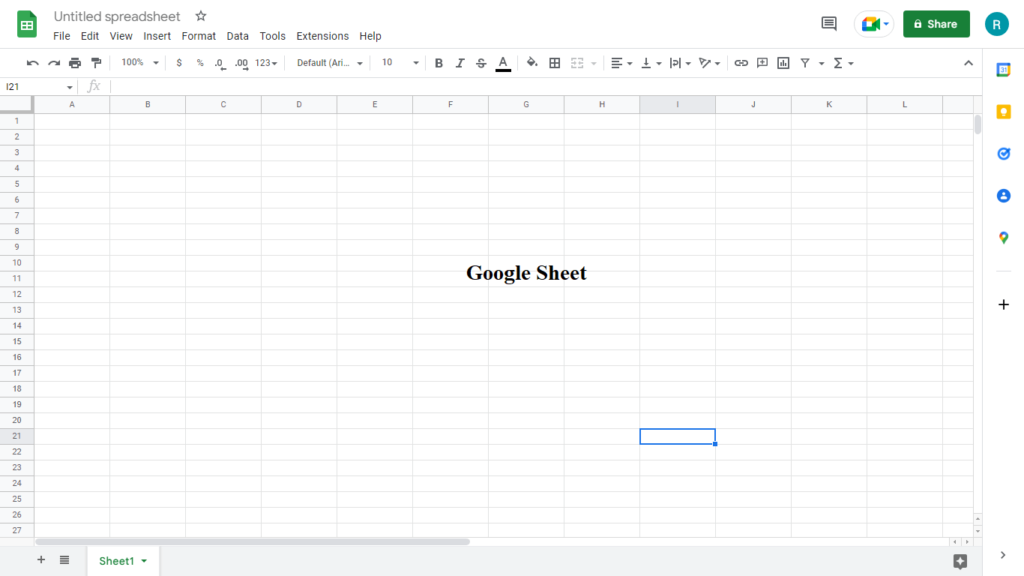
Considering MS Excel, Zoho sheet, and Google sheet, you’ll notice that all of them have all the features described above.
In this section, we discussed the meaning, types, and features of spreadsheets, we’ll now look at the uses of a spreadsheet.
Uses of Spreadsheet Application
Spreadsheets are essential to many small- and large-scale enterprises’ daily administrative operations. A spreadsheet is an essential productivity app that no organization will neglect, no matter the size.
In this section, I’ll show you the uses of spreadsheets in the daily workplace.
10 uses of spreadsheet packages
Flat-file databases
A usual user opens spreadsheet software as soon as any data needs to be collected. The spreadsheet is the obvious choice for contact lists, inventories, and custom item reporting. Both small businesses and large organizations use spreadsheets as flat-file kind of databases to store data. These data may be harmonized at later times for analysis.
Data models
Spreadsheet packages are used to build data models for computations, analysis, and projections. One basic use of a spreadsheet is to perform calculations based on data. A user may calculate totals, averages, etc., whereby different spreadsheet formulas are used. Before analyzing data, relationships between different variables are established. This is called data modeling (organizing data elements and standardizing how they relate to each other). A spreadsheet is mostly used for this purpose.
Whether you are using SPSS, Power BI, R, etc. to analyze data, data models can be imported from spreadsheet packages.
Business processes
A spreadsheet is used by businesses to perform different kinds of activities. It stood out as a commonly used app to record transactions, operations, events, lists, etc. For example, a timekeeper uses a spreadsheet to keep a record of the time each employee comes to work and leaves.
In the production department, it is used to record the total number of products, defects, materials used, etc. Its use in different businesses is unimaginable.
Financial Accounting
Spreadsheets are often used in business to manage accounting data. This includes maintaining a budget and keeping track of receipts and payments. Spreadsheets offer automated currency formatting options as well as the choice to show negative values in red. This gives a clear picture of the financial condition of a business at a glance.
Additionally, some businesses utilize spreadsheets to monitor particular parts of income and expenses in depth. For example, creating a separate page for payroll costs, etc.
Statistical analysis
Spreadsheets offer tools for data analysis and manipulation. Numerous pre-defined functions are available in spreadsheet programs like Excel for doing mathematical and statistical calculations on data sets.
Users of spreadsheets can also develop their formulas to arrive at the analysis needed for a particular business process. Data can be sorted and filtered by users to produce a customized viewpoint.
Averages, Variance, ANOVA, regression, etc are common spreadsheet functions used in statistical analysis. For example, using relevant spreadsheet formulas you can generate a result sheet of students based on scores
Estimation and projections
A spreadsheet dataset can be used to make future estimates and plans for a business. Spreadsheets can be created expressly for projection purposes. You can estimate the effects of future changes in business activities using data already collected about the historical performance of your business. With the use of reliable historical data, you can use this to theoretically evaluate any ideas you have for future development.
Project timeline and tracking of activities
In some businesses, project management tasks may involve the use of spreadsheets. For example, you can create a Gantt chart in a spreadsheet to indicate project timelines and tracking of activities. A project-tracking spreadsheet allows you to list and keep track of the tasks and activities connected to certain projects.
Whether a project is ongoing or just one-time, this kind of spreadsheet can serve as a shared record of its progress. These spreadsheets can also list the team members and their respective roles in a project.
Graphical presentation of data
In many academic fields, spreadsheets are used to depict data graphically for simple data analysis. Pictographs such as pie charts, histograms, line graphs, etc. are used to visualize relationships in a dataset at a glance.
For example, a spreadsheet can be used to graphically analyze the mortality rate, morbidity rate, the rate of spread of an epidemic, etc.
What-if-analysis
A spreadsheet is used to perform what-if-analysis. A what-if analysis is used to see the outcome in different scenarios. Put differently, it is used to know what will happen if a certain condition changes.
What-if analysis aids companies in developing plans to deal with potential dangers in the future. Using a spreadsheet application, you can vary the expected conditions and see how it affects the business.
Break-even analysis
Break-even analysis is used to show the number of sales it will take to cover the total cost of a business. It is used to analyze the point at which a business should cover its costs and start generating profit.
Businesses need these analyses to know the number of products or sales they will make to guarantee profit. With a spreadsheet, the necessary data and formulas required to arrive at the right results will be easily entered. And the result was arrived at with ease.
There is quite a lot you can do with spreadsheet applications. I explained just a few, within each item above, you can extract more than one use. This leads us to the next section, where I will list examples of spreadsheet packages.
Examples of Spreadsheet Packages
As said, spreadsheet is predominantly used in business processes as a major workplace productivity app. In this section, I will list examples of spreadsheet packages you can use to achieve the above functions.
20 examples of spreadsheet package
The table below lists 20 examples of spreadsheet packages you can use to practice some of the uses discussed above. You can also use some of them to practice the spreadsheet formulas and keyboard shortcuts discussed below.
The list gives you easy access to download or visit the platform to practice how to use spreadsheet applications.
| S/N | Spreadsheet package | Description | Platforms | Visit/ Download | Price |
| 1 | Microsoft Excel | A spreadsheet developed by Microsoft for Windows, macOS, Android, and iOS. Among its features is a macro programming language called Visual Basic for Applications (VBA). | Desktop, Mobile, Web | Excel online, Download Excel | Free and Paid |
| 2 | Google Sheets | An online spreadsheet app that lets you create and format spreadsheets and work with other people. | Web | Visit Platform | Free |
| 3 | Zoho Sheet | A collaborative spreadsheet for creative workplaces that is powered by an automated data processor | Web | Visit Platform | Free |
| 4 | Apple Numbers | Along with Keynote and Pages, Numbers is a spreadsheet program created by Apple Inc. for the iWork productivity suite. | Desktop, mobile, web | Download Numbers | Free |
| 5 | Quip spreadsheet | Quip is a collection of web-based productivity tools that enables teams to jointly generate and edit spreadsheets and documents, usually for business needs. | Web | Visit Platform | Free Trial, Paid |
| 6 | EtherCalc | EtherCalc is a web-based spreadsheet that enables remote work and group collaboration. It has no logins and editing locks | Web | Visit Platform | Free |
| 7 | LibreOffice Calc | The spreadsheet component of the LibreOffice package. It is open-source software for everyone. | Desktop, Mobile | Download Calc | Free |
| 8 | OpenOffice Calc | Apache OpenOffice Calc is the spreadsheet equivalent to Microsoft Excel. It is open-source and free for all to use | Desktop | Download Calc | Free |
| 9 | Smartsheet | Smartsheet is a software as a service (SaaS) application created by Smartsheet Inc. It is used to assign tasks, monitor projects, manage calendars, distribute documents, etc. | Web | Visit Platform | Free trial, Paid |
| 10 | Stackby | With the help of Stackby, anyone may build their software by combining spreadsheets, databases, and APIs. | Web | Visit Platform | Free, Paid |
| 11 | SeaTable | An improved spreadsheet-based internet database. Unlike Excel, you can upload pictures and other types of media in addition to text, numbers, and date data types. | Web | Visit SeaTable | Free, Paid |
| 12 | WPS Office Spreadsheet | A free data analysis and visualization tool that provides users with free templates to manage charts, track budgets, and analyze personal or business finances. | Desktop, Mobile, Web | Download WPS Office | Free, Paid |
| 13 | Gnumeric | A spreadsheet program that is part of the GNOME free software desktop project. | Desktop (Linux OS) | Download Gnumeric | Free |
| 14 | SSuite Accel Spreadsheet | Free, powerful, and professional spreadsheet application that has all the tools you need to calculate, analyze, summarise, and present your data in numerical reports or colorful graphics. | Desktop | Download | Free |
| 15 | Quattro Pro | A spreadsheet program developed by Borland and now sold by Corel as part of Corel’s WordPerfect Office suite. | Desktop | Download Quattro pro | Free trial, Paid |
| 16 | PlanMaker | A spreadsheet program that is part of the SoftMaker Office suite. | Desktop, Mobile | Download PlanMaker | Free Trial, Paid |
| 17 | Ability Office | An office suite developed by Ability Plus Software which consists of a word processor, spreadsheet, database, etc. | Desktop | Download | Free Trial, Paid |
| 18 | AirTable | A cloud collaboration spreadsheet database hybrid that incorporates functionality from databases into spreadsheets. | Web | Visit AirTable | Free, Paid |
| 19 | Hancom Office Cell | A feature-rich desktop productivity application for word processing, spreadsheet modeling, graphic presentation, and working with PDFs. | Desktop, Web | Download Hancom Office | Free Trial, Paid |
| 20 | Calligra Sheets | A fully-featured calculation and spreadsheet tool. Use it to quickly create and calculate various business-related spreadsheets. | Desktop | Download Sheets | Free |
Though I prefer Excel, Google Sheets, and Zoho, some of the listed spreadsheet programs are specialized tools. Also, there are lots of free packages you can choose from or even try the paid programs within the specified trial period.
Basic Spreadsheet Formulas You Should Master to enhance Productivity
A spreadsheet is a standard tool for handling data in a workplace. They are widely used in different organizations to enhance productivity and build reports and business insights. To make it useful in business decision-making, there are built-in formulas that should be mastered by their users.
In this section, I will show you different spreadsheet formulas that will enhance your productivity. All you need is to master how to use them in your preferred spreadsheet program.
25 Spreadsheet formulas you must know
To insert a formula or function in a cell in a spreadsheet program you will first insert the “=” sign. However, you can select a built-in function by selecting the fx icon or choosing a function from the Insert menu. This depends on your preferred spreadsheet application.
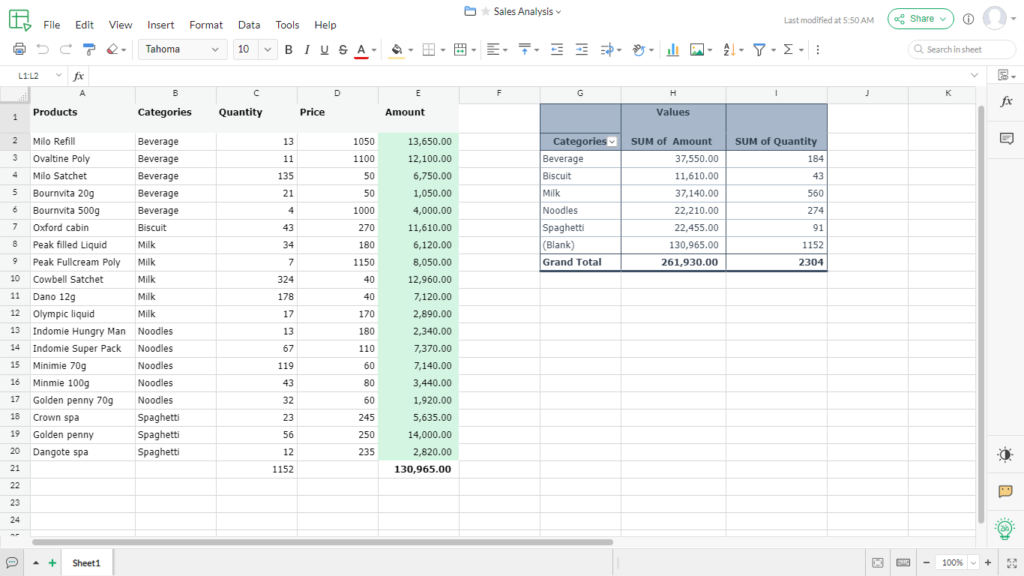
Let us list the basic spreadsheet formulas you should be conversant with in your daily work activities. Using the figure below, use your preferred spreadsheet to practice the formulas. Learn more on how to use Excel formulas and functions in this post.
1. Sum
The SUM() function, as its name implies, returns the sum of the values in the selected range of cells. It performs the addition mathematical operation.
To perform the sum function enter the formula: [=SUM(number1, number2, …]. For example, in the above image, to sum the total amount, enter the formula [=SUM(E2:E20)]. The result will be displayed for you.
2. Average
The AVERAGE() function is used to compute the average or mean value of a selected range of cells. From the above figure, we can calculate the average sales as follow: [=AVERAGE(E2:E20)]. The result will automatically appear as soon as you press the ENTER or RETURN key.
3. Product
The PRODUCT() function is used to multiply two or more variables together. It is simply used to perform multiplication. To use the product function do the following PRODUCT(number1,number2,…).
For example, using the above worksheet, the total amount of Milo Refill sold is [=PRODUCT(C2,D2)].
4. Count
The COUNT() function is used to calculate the total number of cells that have values in a selected range. It usually ignores empty cells and cells without numeric values.
From the figure above, to count the number of quantity cells enter the formula [=COUNT(C2:C20)].
5. Power
The POWER() function is used to evaluate the result of raising a number by another number. For example, 2^3 = 8. To use the function, let’s evaluate the quantity of Milo Refill raised to power 3 as follows. [=POWER(C2,3)].
6. Quotient
The QUOTIENT() function is used to divide a given number (numerator) by another number (denominator). It returns the integer portion of such a division. To divide the total quantity sold by the quantity of Milo Refill enter the formula: [=QUOTIENT(C21,C13)].
7. Max
The MAX() function is used to return the largest value in a selected range. It usually ignores logical values and text. In the image above we can evaluate the product that sold more than others, in terms of quantity as follow [=MAX(C2:C20)]. The result will be Cowbell sachet.
8. Min
The MIN() function is used to return the least value in a selected range. It usually ignores logical values and text. In the image above we can evaluate the product that sold less than others as follow [=MIN(C2:C20)]. The result will be Bournvita 500g.
9. Modulus
The MOD() function is used to return the remainder when a particular number is used to divide another. For example, 13/3 = 4 remainder 1. Hence, {=MOD(13,3) = 1}. OD(13,3) = 1}. You can use the modulus function to evaluate the value when a number is divided by another.
In the above diagram, let’s evaluate the remainder when the total quantity is divided by the quantity of Crown spa sold. [=MOD(C21,C18)]
10. Decimal
The DECIMAL() function is used to convert a text representation of a number in a given base to base 10. Let’s assume that numbers are represented in base 5 or base 7. You can use the Decimal function to quickly convert these numbers to base 10. Let’s illustrate this with the image below.
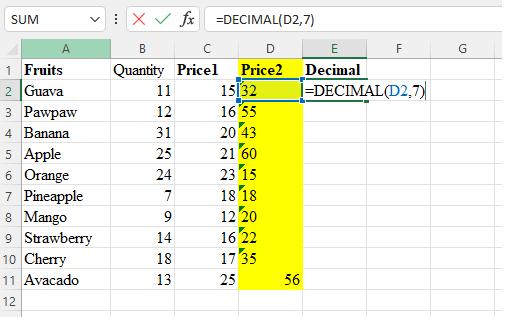
In the above worksheet, price level 2 is represented in base 7. So, to convert the prices to decimals, we use the DECIMAL function as follows. [=DECIMAL(D2,7)], where D2 represents the number and 7 represents the base.
If a selected number is wrongly represented, the result will show an error.
11. Decimal to Binary
The DEC2BIN() function is used to convert a number represented in decimal to a number in base 2. Using this function you can easily perform binary number conversion to speed up your operations.
In the image above, let’s assume that the price level 1 is in decimal. To convert them to binary enter the function: [=DEC2BIN(C2)]. The selected number automatically converts to binary.
12. Other number base conversions
You can also use the following functions to perform number-based conversions.
- BIN2DEC() – converts binary to decimal
- BIN2HEX() – converts binary to hexadecimal
- BIN2OCT() – converts binary to octal number
- DEC2HEX() – converts a decimal number to hexadecimal
- HEX2DEC() – converts hexadecimal numbers to decimal
There are more number basis conversions you can perform using spreadsheet applications.
13. Round
The ROUND() function is used to return a number to a specified number of decimal places. In the above image, let’s divide the price1 of an Avocado by its quantity and round it to 3 decimal places. We have; [=ROUND((C11/B11),3)] with a result of 1.923.
14. Floor
The FLOOR() function is used to round a number down to the nearest multiple of significance. For example, applying FLOOR() to the above result as follow gives the following results: [=FLOOR(1.923,2) = 0]. This is because the nearest lowest multiple of 2 is 0. Similarly, [=FLOOR(1.923,1) = 1], because the nearest lowest multiple of 1 is 1.
15. Ceiling
The CEILING() function is used to round a number up to the nearest multiple of significance. Applying CEILING() to the above result gives the following: [=CEILING(1.923,2) = 2]. This is because the nearest highest multiple of 2 is 2.
16. Upper and Lower
The UPPER() function is used to convert a text string to upper case. Take, for example, if you want to convert all the fruits string to upper case, you use the function: [=UPPER(A2)].
Similarly, the LOWER() function is used to convert a text string to lowercase. Also, the PROPER() function is used to convert to title case or proper case. In the title case, the first letter of each word is in uppercase while others are in small letters.
17. Concatenate
The CONCATENATE() function is used to join several text strings into one text string. For example, in the above image, we can use the function to report as follow. [=CONCATENATE(“The Quantity of”, ” “,A2, ” bought is “,B2)]. The result will be “The quantity of Guava bought is 11.”
18. Len
The LEN() function is used to return the total number of characters in a string. You can use it as follow: [=LEN(A3)], it returns the value 6.
19. Substitute
Use the SUBSTITUTE() function to replace an existing text string with a new one. The syntax of the substitute function is given by “=SUBSTITUTE(text, old_text, new_text,[instance_num]). For example, to replace the text “Guava” on the image above with “Pear” we do the following. [=SUBSTITUTE(A2, “Guava”, “Pear”)]. Similarly, to substitute apple in Pineapple with berry, we have: [=SUBSTITUTE(A7, “apple”, “berry”)].
20. Now
The NOW() function is used to insert the current system date and time in a cell. Simply enter NOW() and press ENTER. The system date and time appear on the active cell.
21. Today and month
TODAY() function is used to return the current system date. Simply enter TODAY() for the current date to appear. You can use the functions DAY(), MONTH(), and YEAR() to retrieve the day, month, and year values in a date.
For example, enter the spreadsheet formula: NOW() to display the current system date and time. Then use:
- DAY() to retrieve the day of the month value from the above date, which will be between 1 – 31.
- MONTH() to retrieve the month of the year value from the above date, which will be between 1 – 12.
- YEAR() to retrieve the year value from the given date
You can use them to transform date data to create different columns for a day, month, and year for ongoing analysis.
22. Time
The TIME() function is used to convert a specified number of hours, minutes, and seconds to the current spreadsheet serial number. These numbers are usually formatted with the time format. For example, Uche came to work at 9.30.25AM. This can be represented as [=TIME(09,30,25)], which your spreadsheet will convert to the appropriate time.
However, in a datasheet that contains time, for example, an employee timesheet, you can extract hours, minutes, and seconds. This will help you perform accurate analysis, in cases where money is deducted or paid for extra time worked.
Hence, the HOUR, MINUTE, and SECOND functions will be relevant. The HOUR() function extracts the hour value between 0 – 23 in a given time. The MINUTE() returns the minute number between 0 – 59 in a given time, and the SECOND() function returns the seconds.
Let’s take the following employee timesheet as a sample to calculate the hours and minutes worked by each employee.
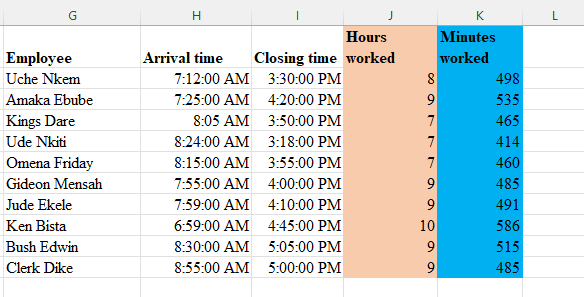
To get the number of hours worked by Uche Nkem, enter the formula [=HOUR(I2)-HOUR(H2)]. The HOUR() function extracts the number of hours in each case and subtracts them to give us 8.
Similarly, to get the number of minutes worked by Uche Nkem, enter the formula [=SUM(MINUTE(I2)-MINUTE(H2),PRODUCT(J2,60))]. The MINUTE function extracts the number of minutes in each case and subtracts them to give us 18. The hours worked are then multiplied by 60 and added to the 18 minutes to give us 498.
23. Date
The DATE() function is used to return the number that represents the date in a spreadsheet’s data-time code. These numbers are usually formatted with the date format. For example, Uche’s date of birth is 7th October 1988. This can be represented as [=DATE(1988,10,07)], which your spreadsheet will convert to the appropriate date format.
24. Datedif
The DATEDIF() function is used to easily compute the difference between two dates. The function uses the year, month, and day values in a date to calculate the difference. For instance, this function makes it easy to compute the age of a person given his/her date of birth and the present date.
The syntax is given by “=DATEDIF(start_date, end_date, type). Where start_date is the starting or beginning date, and end_date is the last or ending date. Type or unit can be any of “Y” for years, “M” for months, “D” for days, “MD” for days difference, and “YM” for months difference.
Let’s illustrate this with the employee worksheet below.
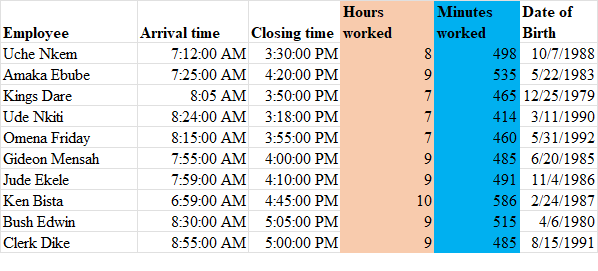
We need to calculate the age of each employee using the current date; thus we enter the formula: [=DATEDIF(F2,TODAY(),”Y”)]. The results are shown in the sheet above.
25. Convert
The CONVERT() function is used to conveniently convert a number from one measurement unit to another. You can convert from meter to centimeter, gram to kilogram, etc.
The syntax is given by “=CONVERT(number, from_unit, to_unit), where number is the value to be converted. The from and to units are expressed in a defined symbol within a quote. For example, “m” represents meter, “in” represents inches, and “ft” foot, etc.
Using the employee worksheet above, we can convert the minutes worked for each employee to total hours worked as follow: [=CONVERT(E2,”mn”,”hr”)].
Perform the task in your preferred spreadsheet and display the result in the comment box.
Spreadsheets have quite many formulas that make them useful for computations and data analysis. Other useful spreadsheet formulas include:
Click on the links above to learn and understand how each of these formulas will help you enhance workplace productivity.
Let us now look at some keyboard shortcuts that will help you speed up your work.
Basic Spreadsheets Keyboard Shortcuts
When it comes to keyboard shortcuts, they may differ in different spreadsheet programs. For example, to save a file in the Zoho sheet, you’ll press CTL+SHIFT+S, instead of CTRL+S. similarly, in Google Sheets, you’ll press CTRL+SHIFT+1.
Yet some shortcuts are universal to most spreadsheet programs. In this section, we shall list out basic keyboard shortcuts that will help you work faster and smarter.
35 basic spreadsheet keyboard shortcuts to work smarter
The table below lists 35 basic spreadsheet keyboard shortcuts that will help you work faster and smarter. The shortcut keys are mostly the same in most spreadsheet programs, especially, popular ones.
| S/N | Keyboard shortcut | Usage |
| 1 | CTRL + O | Open a file or a workbook |
| 2 | CTRL + W | Close an open file or workbook |
| 3 | CTRL + C | Copy selected text or objects to the clipboard |
| 4 | CTRL + V | Paste a selection or current clipboard content |
| 5 | CTRL + X | Cut or move selected text or objects to the clipboard |
| 6 | CTRL + Z | Undo recent action(s) |
| 7 | CTRL + Y | Redo recent action |
| 8 | CTRL + P | Open the print dialog box to print the current file or workbook |
| 9 | CTRL + S | Save the current workbook or file |
| 10 | DELETE | Remove selected item(s) or content |
| 11 | CTRL + B | Apply bold formatting to selected items |
| 12 | CTRL + I | Apply italic formatting to selected items |
| 13 | CTRL + U | Apply underline formatting to selected items |
| 14 | CTRL + 9 [+ ALT] | Hide selected rows |
| 15 | CTRL + 0 [+ ALT] | Hide selected columns |
| 16 | SHIFT + F11 | Insert a new worksheet |
| 17 | CTRL + SHIFT + = | Opens insertion dialog box to insert a new cell, row, or column |
| 18 | CTRL + SHIFT + 9 | Unhide hidden rows |
| 19 | CTRL + SHIFT + 0 | Unhide hidden columns |
| 20 | CTRL + K | Insert hyperlink to the active cell |
| 21 | CTRL + D | Fill down a value or formula in the selected range instead of using the autofill handle |
| 22 | CTRL + F | Open the find dialog box to find an item within a spreadsheet |
| 23 | CTRL + ; | Insert the current system date into the selected cell |
| 24 | CTRL + H [+ SHIFT] | Replace an item with another item in a spreadsheet |
| 25 | CTRL + SHIFT + ; | Insert the current system time into the selected cell |
| 26 | TAB | Move to the next cell in a row |
| 27 | SHIFT + TAB | Move to the previous cell in a row |
| 28 | F2 | Edit a selected cell |
| 29 | CTRL + SPACE BAR | Select an entire column |
| 30 | SHIFT + SPACE BAR | Select an entire row |
| 31 | = | Start a new formula insertion |
| 32 | SHIFT + F3 | Open the insert function dialog box to insert a new function |
| 33 | F4 | Use to toggle between absolute and relative cell referencing |
| 34 | ALT + = | Apply the Auto SUM function to the selected range |
| 35 | CTRL + A | Select entire worksheet |
There is more spreadsheet shortcut than is listed above. You should discover them as you work with your preferred spreadsheet program.
Conclusion
There are many useful spreadsheet formulas to enhance your workplace productivity. This guide should have helped you understand how to use some of them.
Now, I’ll like to hear from you: what formulas should I have added? Which shortcuts are mostly used in your preferred spreadsheet? Which spreadsheet program do you think is a better alternative to Microsoft Excel?
Whatever your questions and suggestions may be, please, kindly let me know by leaving a comment below.


Good write up, very educative.
Thanks
You’re welcome.