Category InfoComTech

Types of Charts in Excel and Their Uses

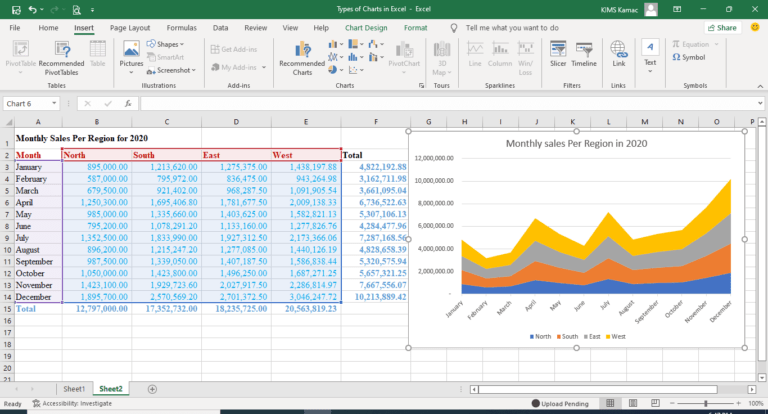
types of charts in Excel - stacked area
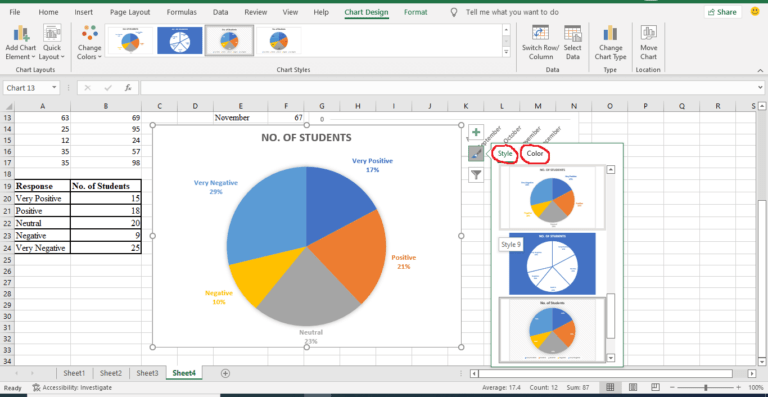
There are different types of charts in Excel that are used to simplify data analysis and visualization. Microsoft Excel has columns, lines, pie, doughnut, bar, area, scatter, and more charts to choose from. Excel 2016 included other charts types including treemap, sunburst, histogram, box and whisker, waterfall, and funnels.

How to use Vlookup Formula in Excel

vlookup and nested IF function
The Vlookup formula in Excel can be used to extract values in a table of data. It is a useful function that is used to query a data table and extract items or values in an Excel table or range. Vlookup means vertical lookup, and it’s one of the few functions in the Lookup and Reference functions category.