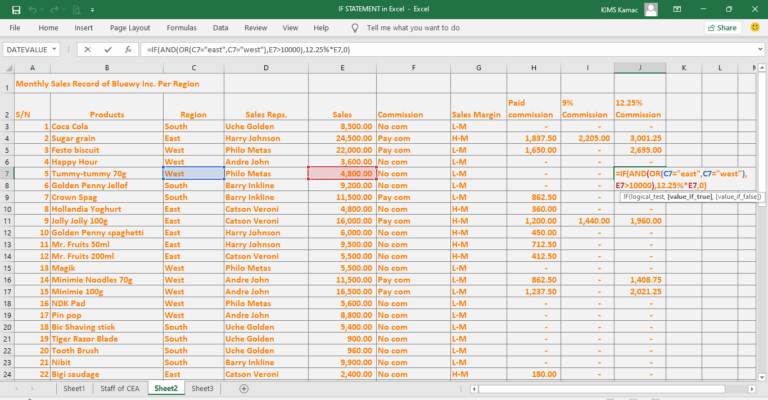
The IF statement in Excel is one of the logical functions in Microsoft Excel. It is used to return values when used alone or/and when used alongside other logical functions discussed previously. The IFS function in Excel makes it easier to use multiple conditions than the nested IF statements. It returns the value if TRUE for up to 127 conditions.
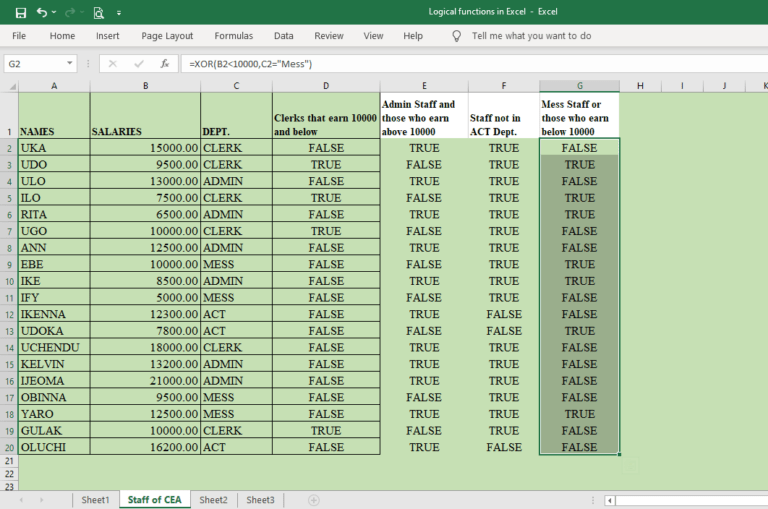
Logical functions in Excel are used to test the conditions of an argument whether it is TRUE or FALSE. There are different built-in logical functions in Excel, but the most used ones are AND, OR, NOT, and XOR.
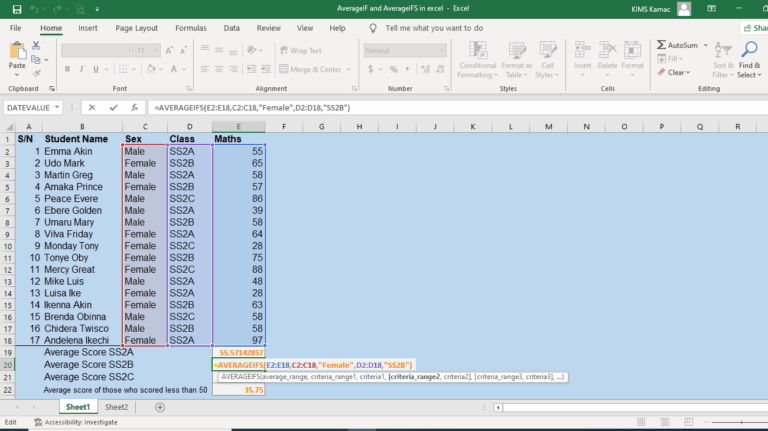
The AVERAGEIF and AVERAGEIFS function in Excel are predefined functions that calculate the arithmetic mean based on specified criteria. You can use either function to calculate the average value of a range of data when they meet specified conditions.
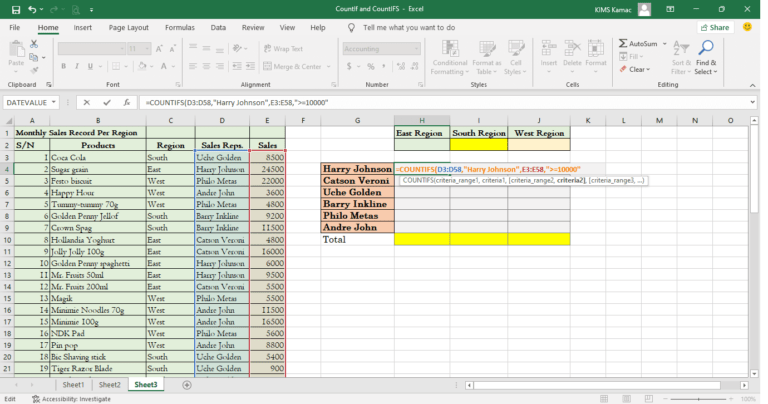
The COUNTIFS and COUNTIF function in Excel are predefined functions that count cells based on specified criteria. You can use either function to count a range of cells when there are conditions associated with your data.
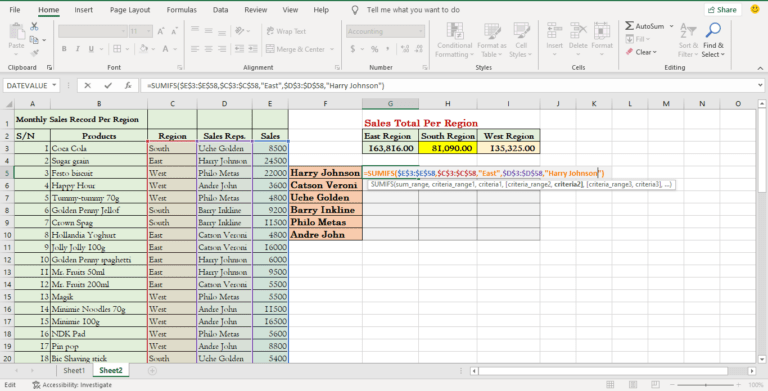
The SUMIF and SUMIFS in Excel are predefined functions that calculate totals based on specified criteria. You can either function to manipulate data when there are conditions associated with your data.
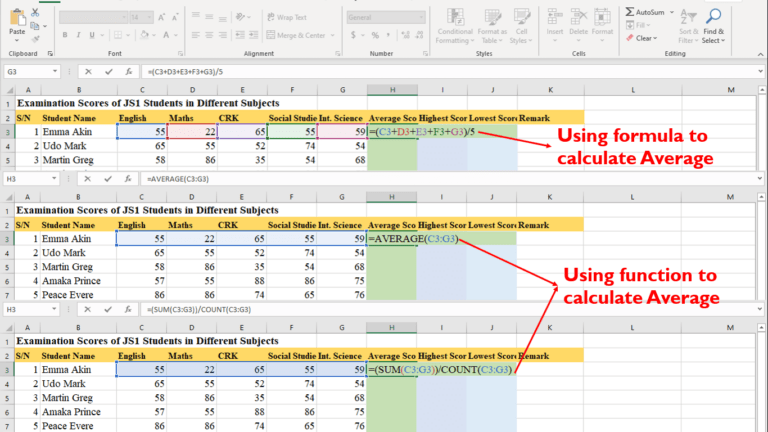
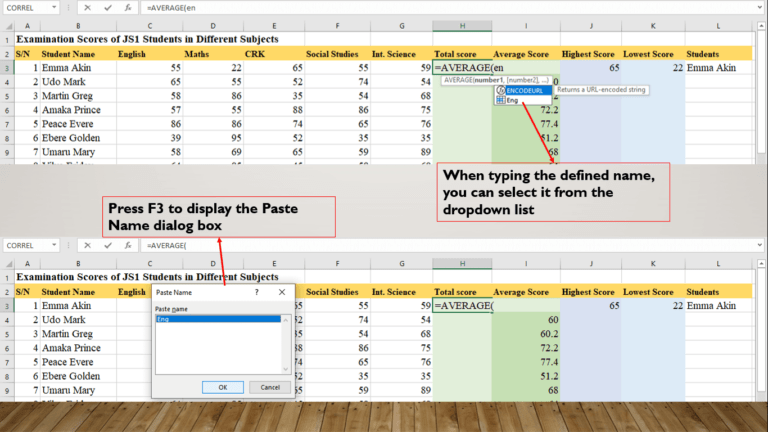
This tutorial introduces how to use Excel formulas and functions. Formulas are expressions entered by a user for the purpose of calculating cell values. Functions, on the other hand, are predefined formulas built into Excel that assist in data analysis.
Cell referencing in Excel is the process of representing the value of a cell in another cell within a workbook. It is an indispensable knowledge when mastering Microsoft Excel. There are five different types of cell references in Excel.
A worksheet in Excel is a collection of cells organized in columns and rows as in a table. A worksheet is a workspace where a user enters data and performs the necessary computations on data. By default, Excel 2016 has one worksheet. You can add more sheets in a workbook, but one worksheet will always be active at a time.
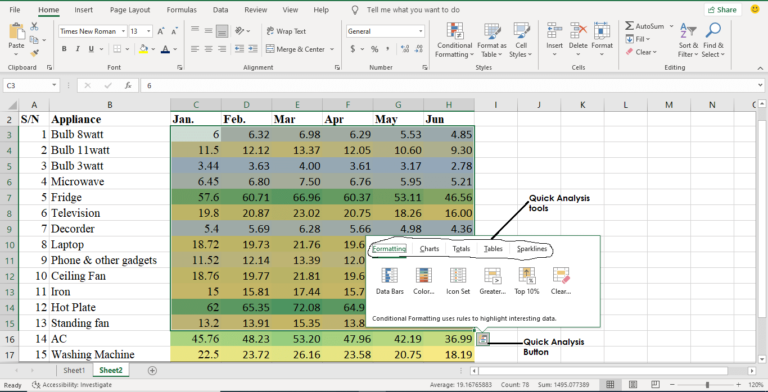
Conditional formatting in Excel is an important tool used for effective data analysis. It is a tool that helps you identify and critically visualize cells that have patterns and trends using colors.
It is an interesting data analysis tool that identifies cell variations based on true data conditions. When conditions are specified, cells appearances may vary in compliance with the specified conditions. In this tutorial, we discussed what is conditional formatting in Excel and how to use them in your datasets.
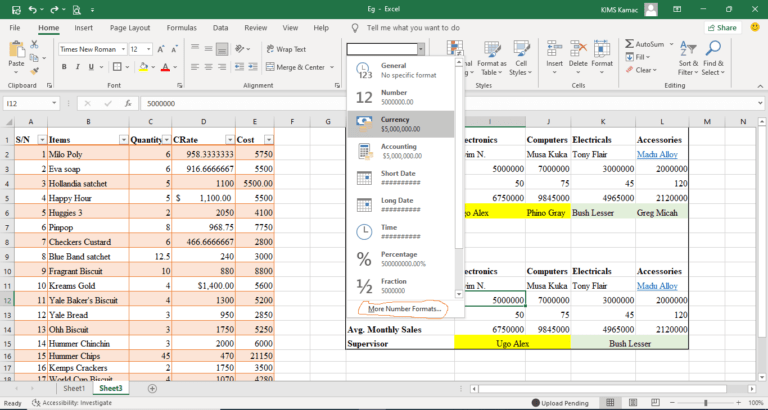
Entering data in Excel is the same as typing text and numbers into the cells in an Excel worksheet. Formatting data in Excel is a process of modifying and customizing the texts and numbers entered. There are three methods of inserting data in a worksheet. We discussed how to enter data and format cells in a worksheet.
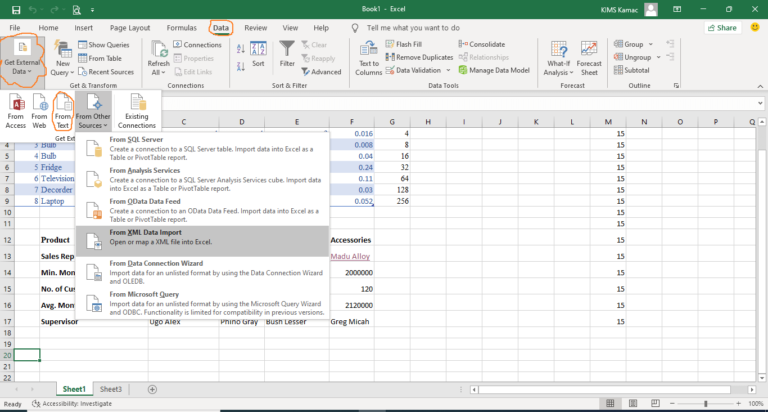
Microsoft Excel is a proprietary spreadsheet application developed by Microsoft. Its first version was released for Macintosh in 1985 and later for Windows in 1987. MS Excel is an office productivity app that enhances productivity, especially, in the area of computations and analysis. It is loaded with formulas that help to perform statistical, engineering, mathematical, logical, etc., computations. In this tutorial, we shall take a look at what is Microsoft Excel and its key features.
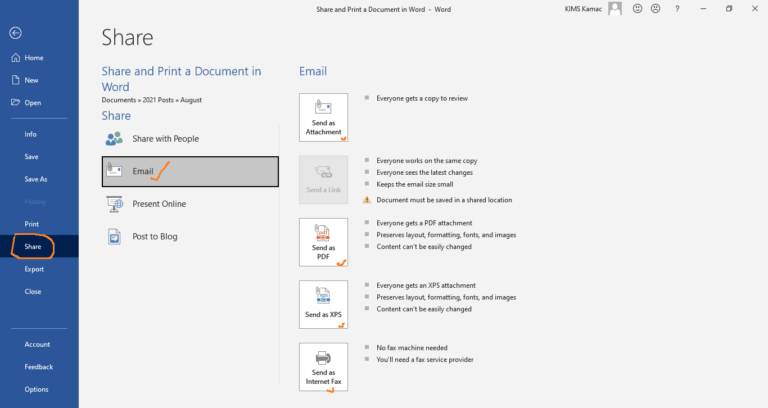
We discussed how to share and print a document in Microsoft Word. To share a document you can use an email or a cloud service. Microsoft provides both services to their users using outlook and OneDrive respectively.