Types of Charts in Excel and Their Uses

There are different types of charts in Excel that are used to simplify data analysis and visualization.
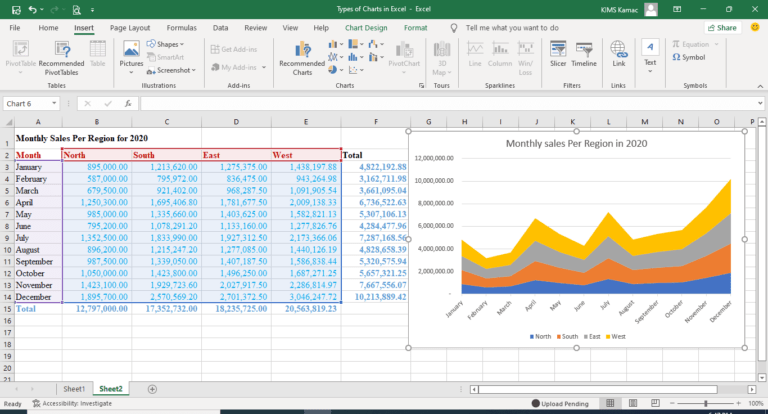
Microsoft Excel has columns, lines, pie, doughnut, bar, area, scatter, and more charts to choose from. Excel 2016 included other charts types including treemap, sunburst, histogram, box and whisker, waterfall, and funnels.


